
01
Your watchlist. In focus.
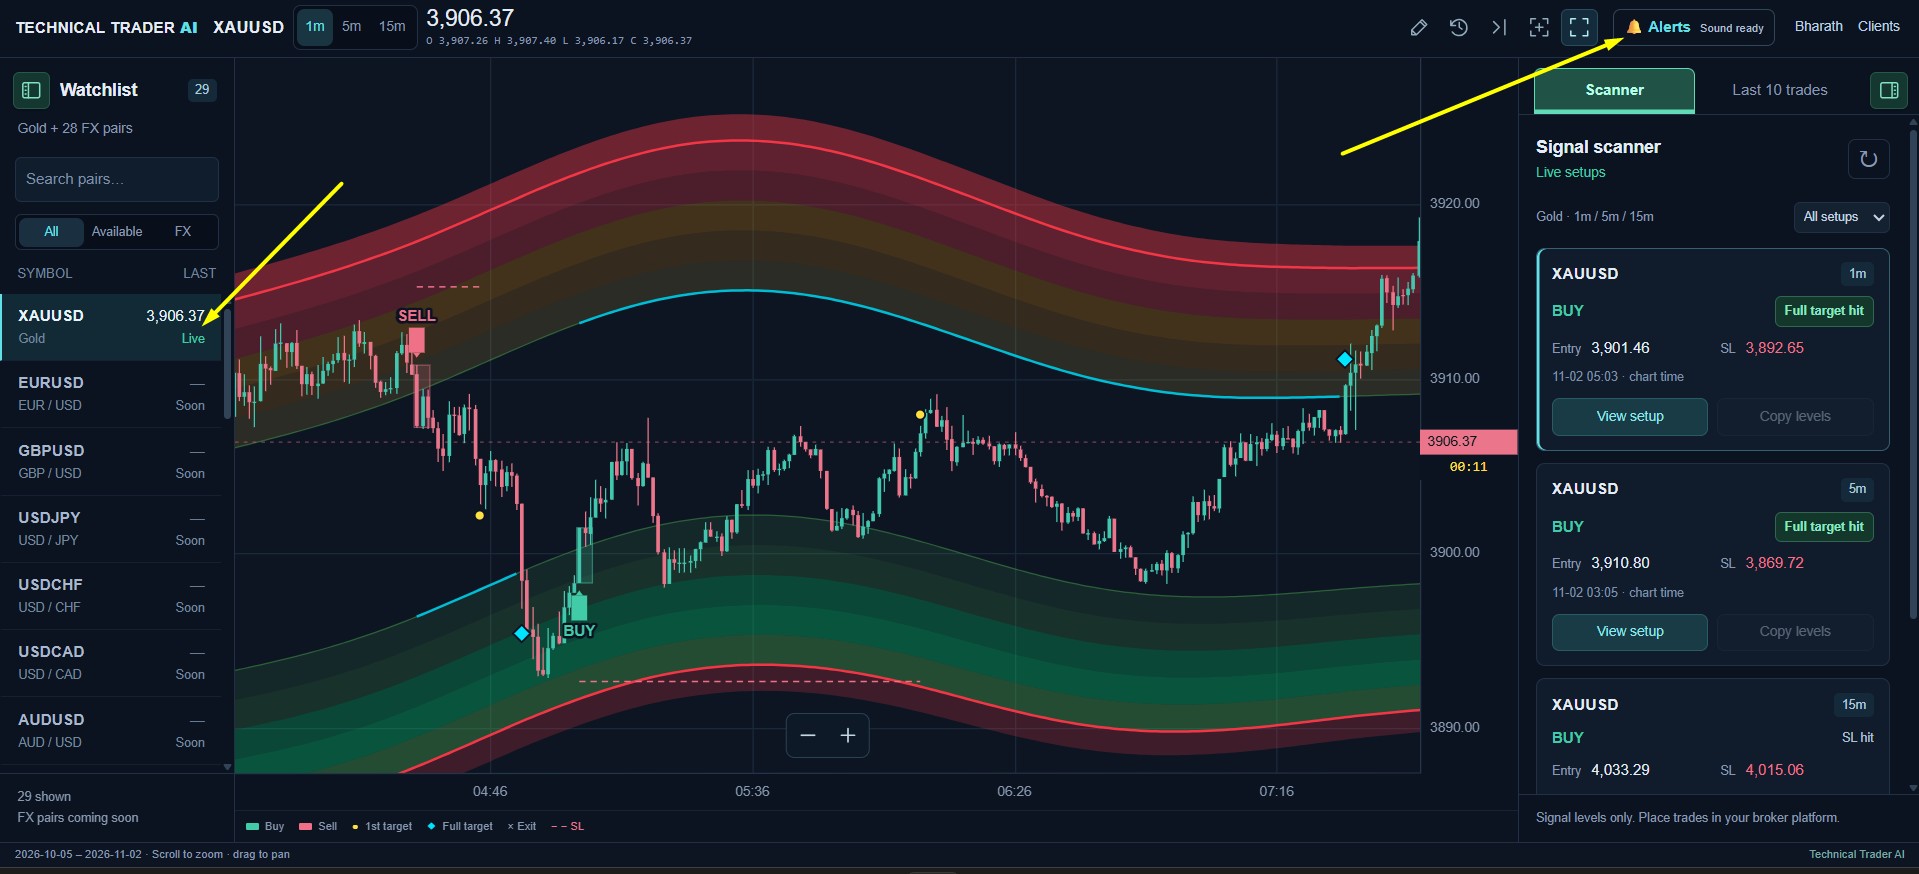
Review signals for available instruments in the scanner, then open a setup to inspect its chart. Gold is active in this preview; FX pairs are marked coming soon.
Technical Trader AI Charts
A closer look at our own charting platform. Follow price, explore visual setups and review recent signals in one focused workspace.
Existing paid subscribers only. Charts account activation is required.
Inside the workspace
Designed to make chart review clearer, from your first scan to a look back at recent signals.
Review signals for available instruments in the scanner, then open a setup to inspect its chart. Gold is active in this preview; FX pairs are marked coming soon.
Use Alerts in the top-right corner to manage notifications and sound while you follow the chart.
Open Last 10 trades to review recent signal setups and their displayed outcomes. This is a signal history, not a broker execution report.
Explore 1m, 5m and 15m charts with visual Buy/Sell signals, support and resistance areas, stop-loss levels and target markers. Adjust the timeframe in Settings under Inputs where available.
For our paid members
Already subscribed to Technical Trader AI? Sign in with your activated Charts account, explore the workspace and tell us how it works for you.
Contact support using your subscription email if you have not received your Charts account details.
Use your individual Charts account.
Try the timeframe controls, scanner, alerts and recent signal history.
Tell us what worked and what needs attention. Include your device and timeframe.
Send feedback